Quantum Program Visualization Tool
The Classiq analyzer application helps you visualize and analyze quantum programs. The input to the application is a quantum program synthesized by the Classiq synthesis engine, or an OpenQASM quantum program.
Accessing the Quantum Program Visualization Tool
There are two ways to view a quantum program using the visualization tool:
- Through the Classiq Python SDK
- Direct access via the Classiq IDE
Classiq Python SDK
- Synthesize a quantum program using the Classiq Python SDK and then run this code:
from classiq import Output, QBit, allocate, create_model, synthesize, show
from classiq.qmod.quantum_function import QFunc


@QFunc
def main(res: Output[QBit]) -> None:
    allocate(1, res)


model = create_model(main)
qprog = synthesize(model)
show(qprog)
Direct Access
- Drag and drop, or select a file that contains a quantum program synthesized using the Classiq engine (
qprog.save_result("file-name"))) into https://platform.classiq.io/circuit/new. - Synthesizing a quantum program using the IDE (https://platform.classiq.io/synthesis) automatically redirects you to the visualization tool.
Using the Visualization Tool
The Classiq analyzer quantum program visualization tool provides a hierarchical image of the quantum program, as well as a higher level, interactive representation of functions, gates, qubits, and operations.
Once you have loaded and analyzed the quantum program input, the analyzer displays an interactive chart, like this:
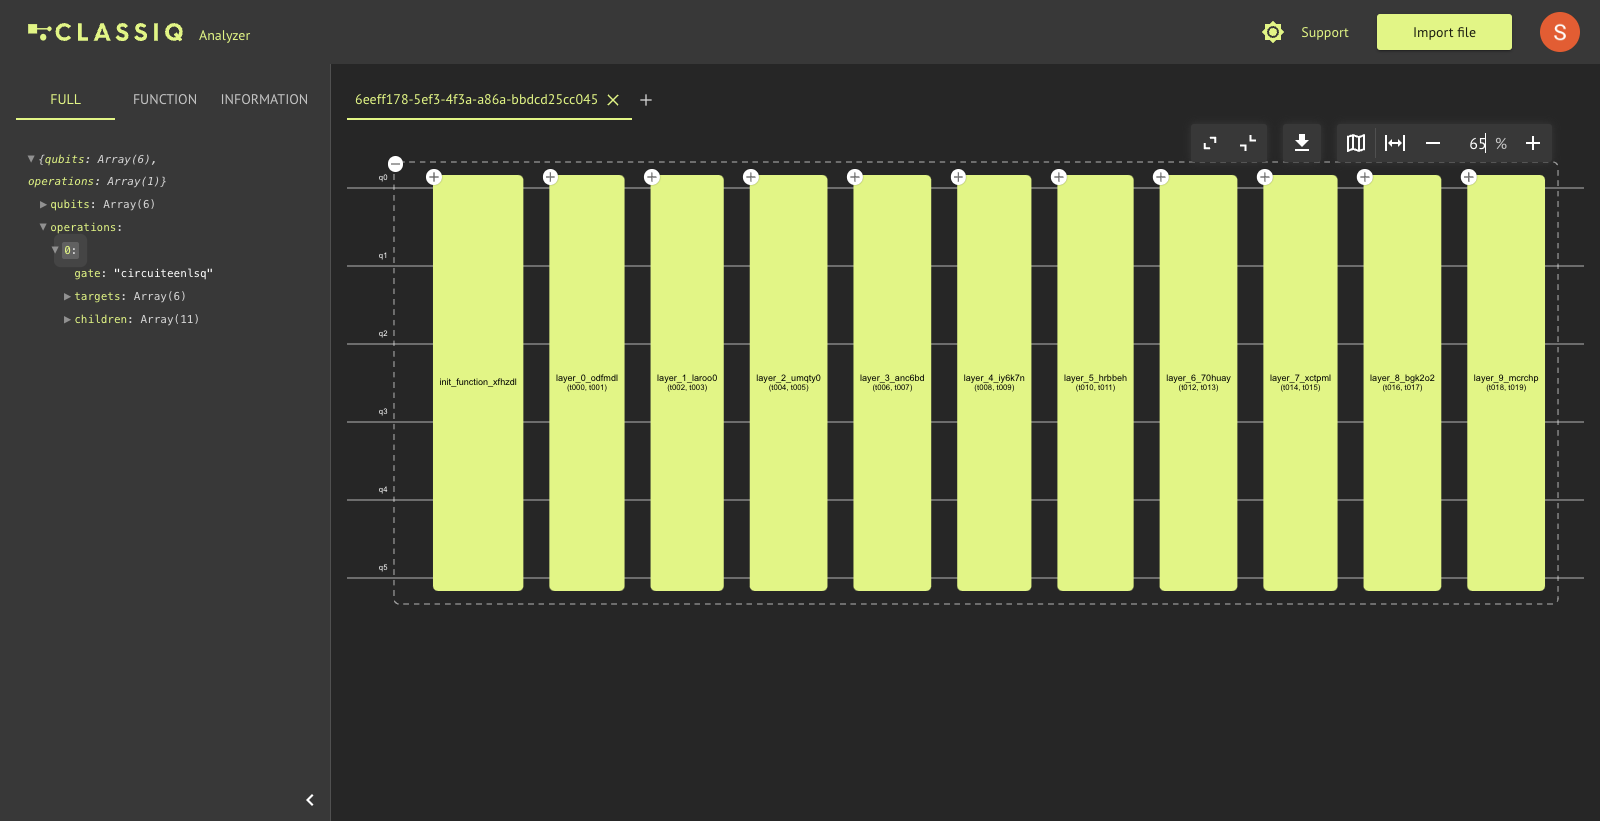
Functions
The bars represent the functions used in the quantum algorithm, and the grid models the qubits employed in the quantum program. For a detailed view, click the "+" button on the top left and see the gates that make up these functions.
Change the labels of functions and gates by double-clicking their captions:
Wire Manipulations
By default, the qubits on which your quantum algorithm operates are named q0, q1, q2, etc. To rename the qubit lines in your quantum program schema, double-click a qubit name and change it in the rename dialog.
Merging Wires into Registers
The qubit toolbar provides further insights into your quantum program analysis. It becomes visible as a popover when you click a qubit segment. To collapse adjacent qubits into a register view, choose two adjacent qubits simultaneously (using Ctrl on Windows and Cmd on a Mac) and click the "Merge" button.
To revert to the original view, click the "Unmerge" button.

For detailed information about the registers in your quantum program, see the JSON representation of your quantum program in the left drawer of the application.
Coloring
To give special labels to your qubit segments or to play around with the colors of the qubits—for example, to highlight particular portions of your quantum algorithm—use the qubit toolbar:
To analyze multiple quantum programs in the same session, see the analysis results of each quantum program in their separate tabs. To rename the title of each tab, double-click it.
Tabs
To upload a new synthesized quantum program, open a new tab by clicking the "+" button on the top right of the tab panel.
To inspect the structure and properties of your quantum program, access the circuit inspector on the left. The inspector includes these tabs:
- The Full tab displays analysis information for the entire quantum program. Selected functions/gates are highlighted in this tab as shown below. You can also click on a function name in the inspector to highlight the corresponding gate block in the quantum program chart.
- The Function tab displays information specific to the function, such as the target qubits on which the function operates and the quantum gates it includes.
- The Information tab supplies general information on the selected function or gate, such as the registers, depth, and width.
- The search icon 🔍 let you search functions and gates by their names. Click any search result to locate it in the quantum program chart view.
Task Bar
On the top right is the analyzer task bar:
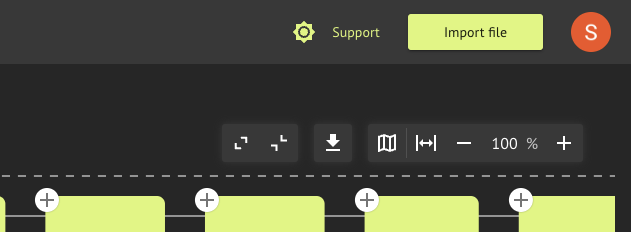
The taskbar has these button groups (from left to right):
- This group controls the hierarchical view of the quantum program chart: expand all the functions and/or gates to the lowest level analysis of quantum gates utilized in your algorithm; or collapse all the bars and revert the chart to the original view displayed when the quantum program input was first loaded, so that this single bar models your entire quantum algorithm.
- This (single) button exports your analysis insights into a JPEG image, JSON text file, or an interactive HTML chart.
- The map button navigates through different components of your quantum program chart so you can shift the screen focus to gates and functions that are outside the view.
- This group scales your quantum program chart: scale the quantum program chart to the default scale value (currently 90%); zoom out of the quantum program chart; change the current scale or zoom level of the chart; or zoom in.